Using CodeViz
CodeViz (archive.org, github) lets you visualize function calls in a program, it generates dot description file of the callgraph, which can be visualised using GraphViz.
.cdepn files are used to generate the callgraph. You need to compile your program with patched gcc to create .cdepn files. Patches and patching and installing scripts are included in CodeViz download.
When you have .cdepn files, run
genfull -g cdepn -o full.graph
to generate dot definition file of full callgraph.
It may be too complicated to help you understand anything (+ some other problems described on CodeViz website), so you might want to create subgraphs.
gengraph -k -v -f top_func -g full.graph -o full.ps
gengraph generates a postscript file from graph definition specified with -g. You can use it to create subgraphs specifying top level unctions with -f, ignored function with -i and more (for help run gengraph –man).
So it will generate a postscript file using the dot roadmap of GraphViz, which is suitable for hierarchical things (look here http://www.graphviz.org/about/ ).
But you may not want postscript or you want to try another roadmaps. Here comes the -k option, that will tell gengraph to keep the dot definition file of your subgraph. You will find it in file sub.graph.
Now you can use graphViz to visualize sub.graph (or full.graph).
fdp -Tsvg sub.graph > sub_fdp.svg
Will generate a .svg file of subgraph using fdp roadmap.
circo -Tpng full.graph > full_circo.png
Will generate a .png image of fullgraph using circo roadmap.
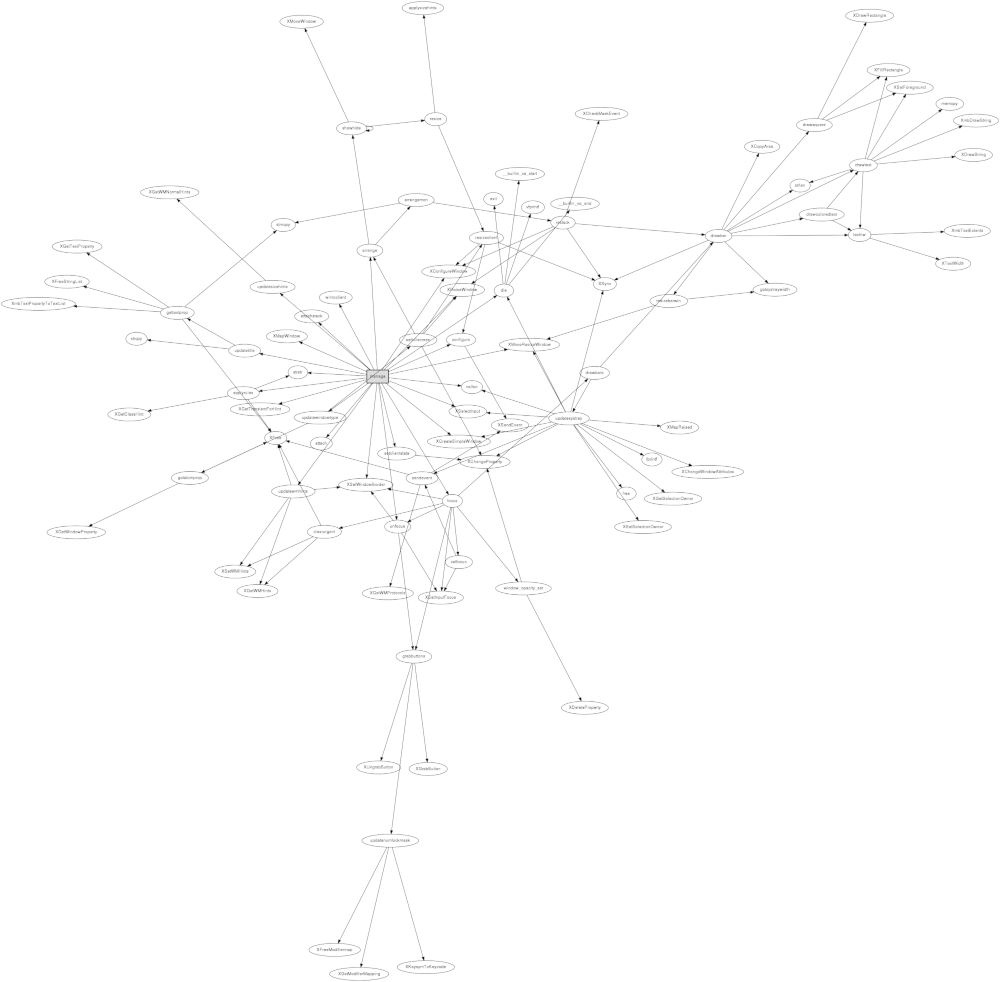
Or you can use viewers like Xdot to view the graph
xdot sub.graph
Now how does it look like? Here is dot and fdp of windows manager dwm with top level function manage.